Manager Page Overview
Table of Contents
This panel shows the status of the system services, the indexer and spider status, system information and the enabled modules.

Services
This panel shows the services viewable for case managers.

- Indexer
This displays whether the the indexer is enabled or not. Here it’s also possible to stop or restart the indexer.
- Processing status
This displays whether the indexer is busy (active) processing or not.
- Clean index
It’s possible to clean the index within a case.
Caution
If you decide to clean the index please keep in mind that the whole case will need to be reindexed and that all progress you’ve done so far will be lost. This action is irreversible, so be cautious when using this feature.
Progress Status
This panel displays the general status of the indexer within the case you’re viewing.

It displays the following statistics:
- Progress
Percentage of collection index progress.
- Collection
Name of the collection that is currently being indexed.
- Time passed
Time passed since starting indexation on this collection.
- Time remaining
Estimate on the time needed to fully index the current collection.
- Total number
Number of items in this collection that need to be indexed.
- Items processed
Number of items in this collection that have been indexed.
Checks & Balances
Shows whether the indexed documents adds up correctly. There are three different statuses that can be shown:

- Everything adds up correctly
This means that the sum of documents in the case match with what the indexer found.
- There are missing documents
This means that the sum of documents in the case do not match with what the indexer found. In this case there are missing documents and you can investigate these by clicking the link provided.
- Sum of docs in workflow is different from total in index
This means that the sum of documents in the case do not match with what the indexer found.
Important
Please keep in mind that while the case is still indexing the checks & balances status will vary. After the indexation process of your case is completely done, everything will usually add up correctly.
Index Stats
Index stats displays some basic information about the indexed source(s).

- Number of documents
Shows the number of indexed documents.
- Counted number of documents
This only shows up when there are missing documents and displays the total count of documents.
- Missing documents
This only shows up when there are missing documents and provides a link to see the missing documents.
- Not indexed documents
This only shows up when there are documents that aren’t indexed. Shows the number of not indexed documents.
- Size of source
Shows the size of the source(s) connected in MB.
- Mail parents
Shows the total number of indexed mail parents.
- Document parents
Shows the total number of indexed documents.
System Status
System status displays some basic system statistics and the appliances current workload.

It displays the following statistics:
- Uptime Current
Uptime of the appliance.
- Software Version
Current software version.
- Users
Number of users in the system.
- Queries
Total number of queries ran on the appliance. This includes system queries as well.
- IP Current
IP address of the appliance.
- Harddisk Current
Disk usage of the appliance.
Note
External mounts are not taken into account.
- Load
Current workload on the appliance.
Workflow
If workflow is enabled, this panel shows the workflow states and how many documents are in the different available states. The image below is an example of our standard workflow, but this might look different depending on how the workflow within your case is set up.

Tag Info
Within this panel an overview is given of the available tags and how many documents are tagged with the specified tag. If there are tagged documents you can also download a CSV list (up until max 50K documents within that tag).

Shares
This panel shows an overview of the connected shares.

It’s also possible to view a report of a share by clicking the button report. This will bring you to a new page with a report about that source. (See part of an example in the image below)
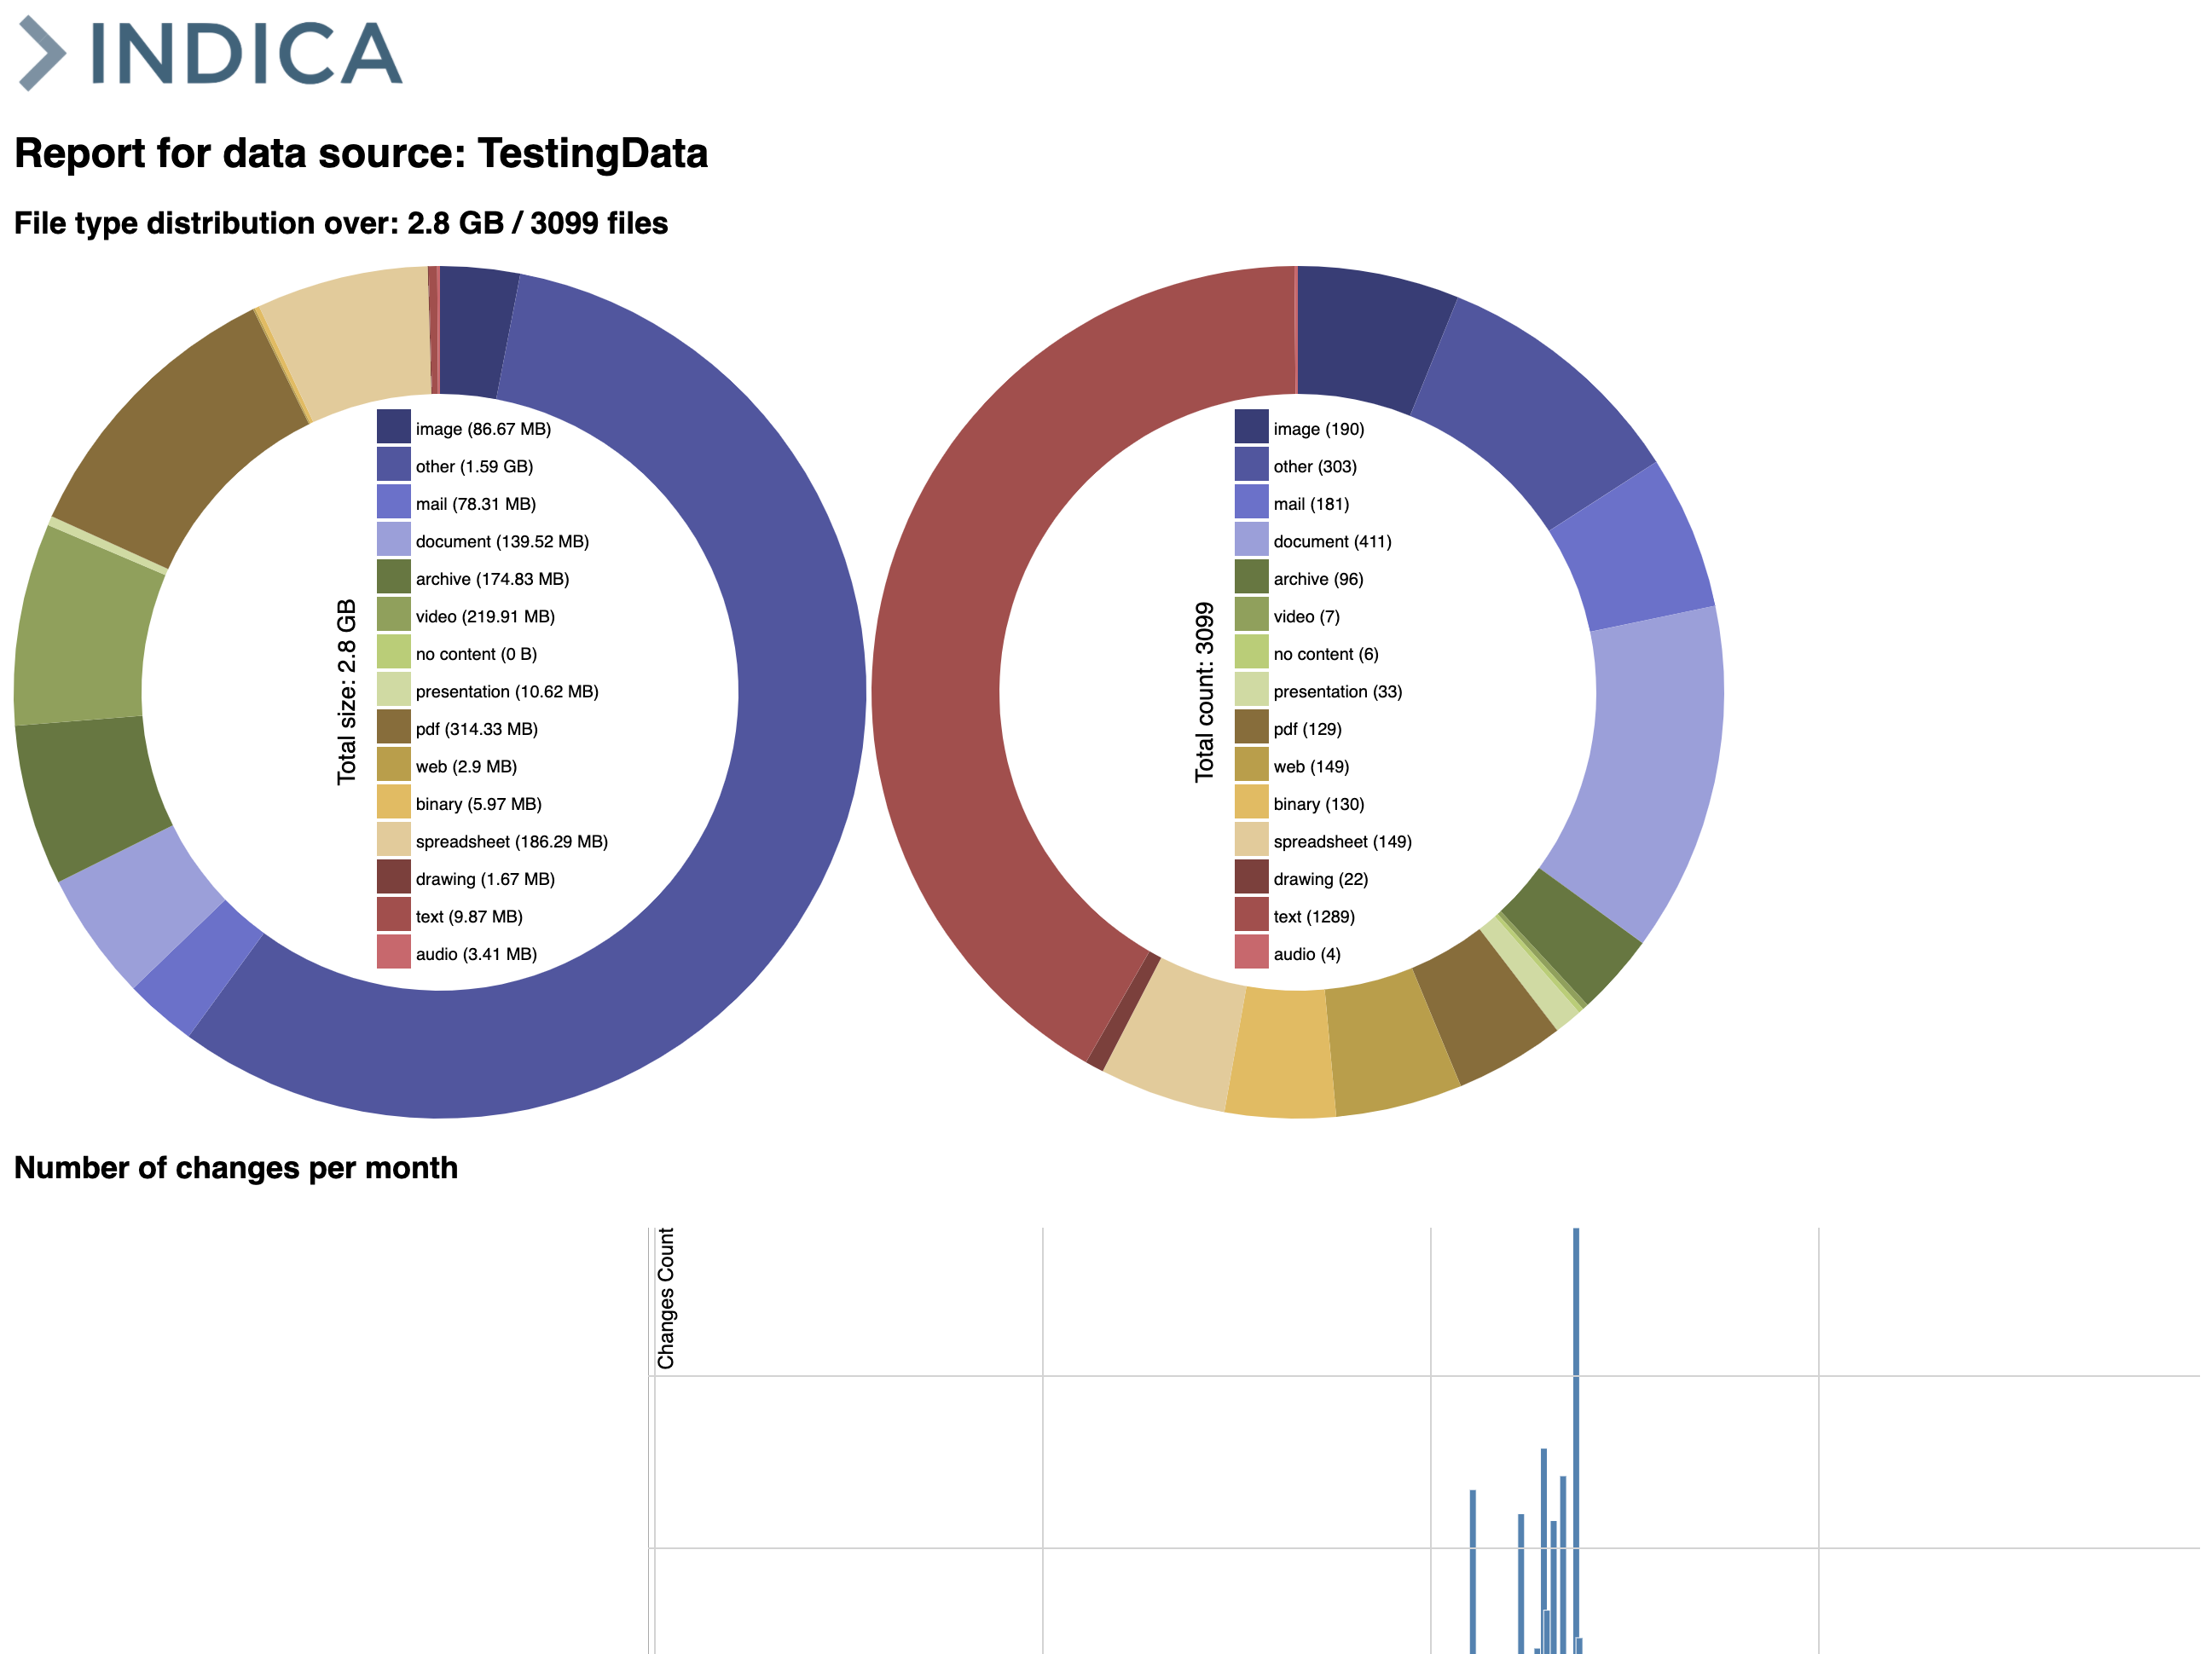
File Distribution Info
Within the table in this panel an overview is given over the different types of documents. This also shows the count of documents found within that type and how big the size is of all those documents from that type.

File Processing Info
Within the table in this panel an overview is given over the different types of processed documents. This also shows the total count and you’re able to download a CSV file with a list of the processed documents (up until max 500K).
