Admin Page Overview
Table of Contents
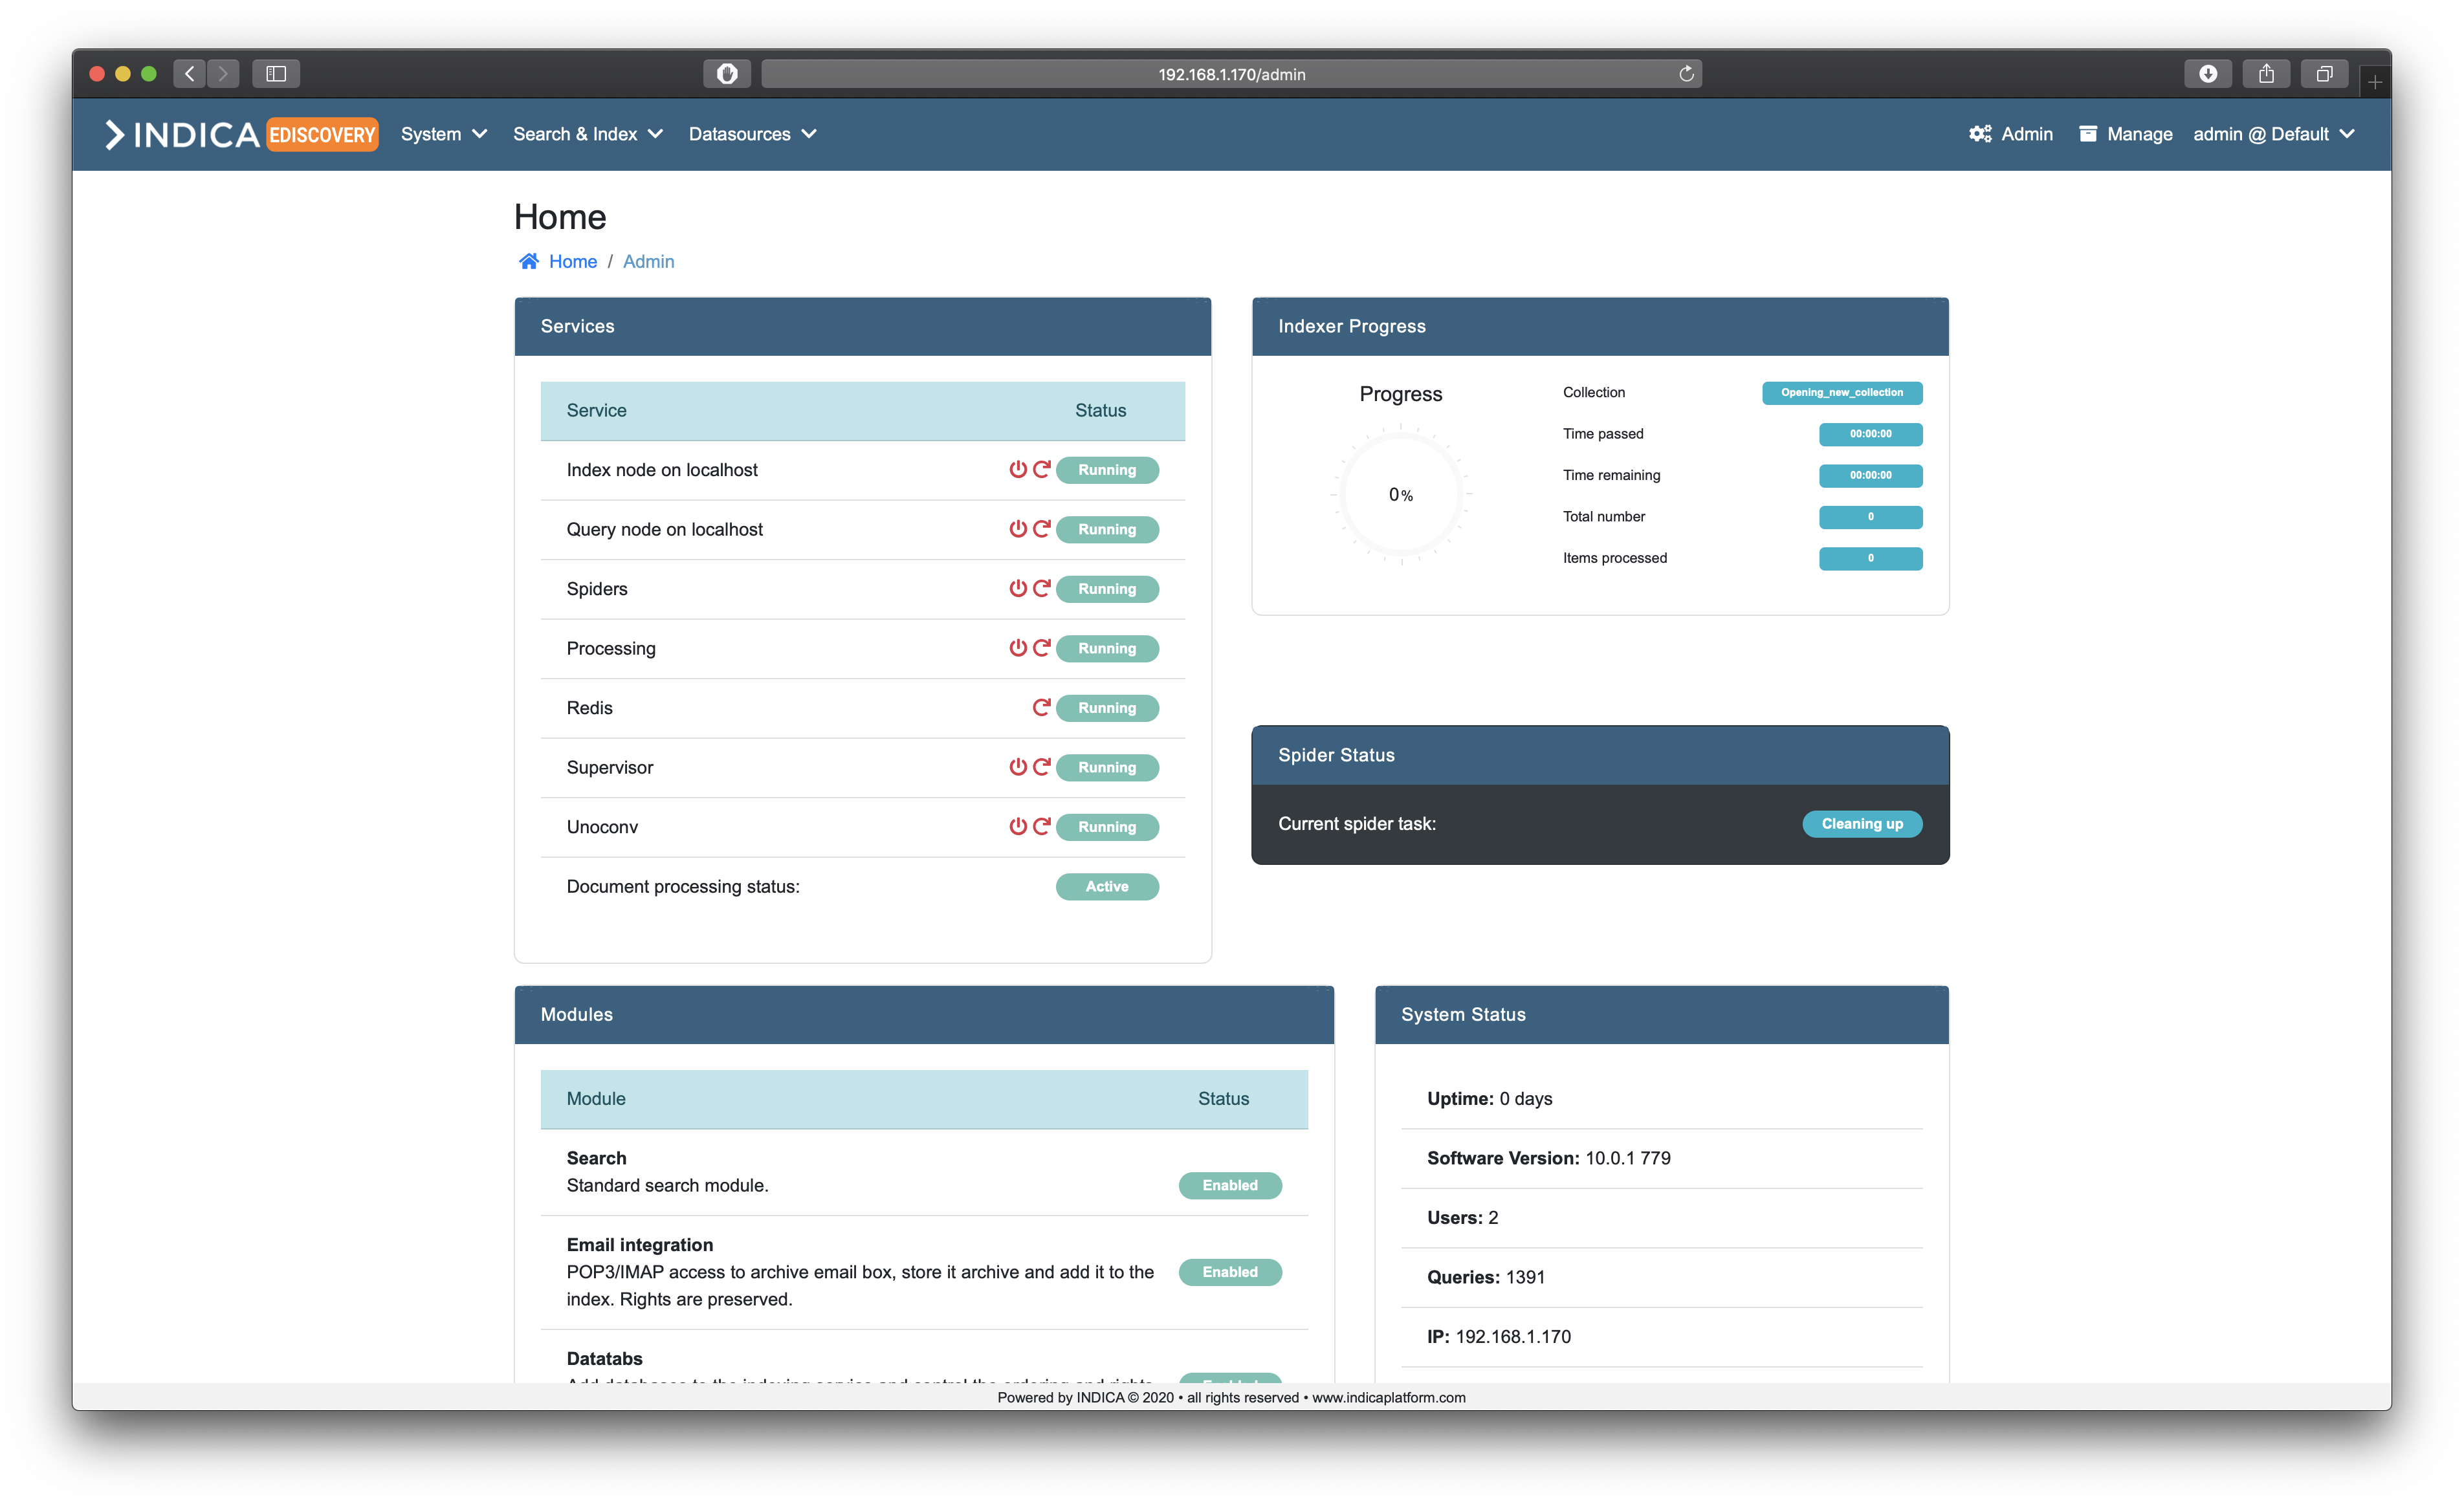
This panel shows the status of the system services, the indexer and spider status, system information and the enabled modules.
Services
In this panel a number of system services and their status is shown. On a single-node install, all services are running on the same machine. With cloud setups, it’s possible to host some services on different nodes.
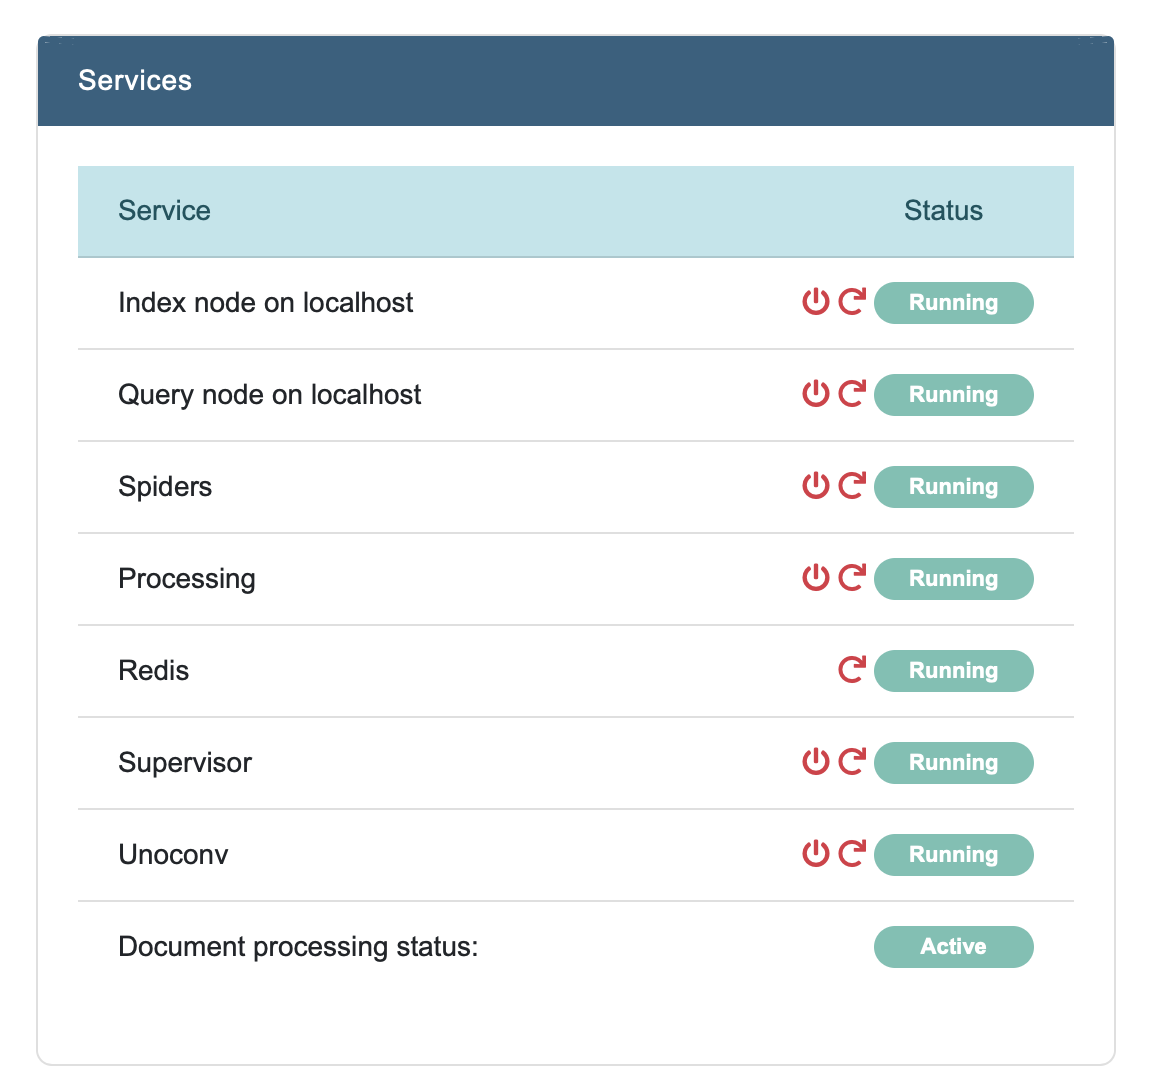
Most services can be stopped, started or restarted from this overview.
- Index node
This displays the status of the Solr service on the Index node. When stopped, the index is not hosted anymore.
- Query node
This displays the status of the Solr service on the Query node. When stopped, the index is not hosted anymore.
- Spiders
This displays the status of the Spider service. The spider is responsible for discovering new and/or changed data in the connected sources. Stopping the spider here will disable the spider for all cases on the appliance. The spider can also be disabled per-case in the “Cases” overview.
- Processing
This displays the status of the Apache Tika service. Apache Tika is responsible for parsing document content to plain text for storing in the index.
- Redis
Redis is needed to make the web front-end work. When this is disabled, most parts of the front-end will not work. Therefore, it can only be restarted.
- Supervisor
Supervisor is needed to enable running of jobs on basis of a queue. Without supervisor, some functions will not work properly.
- Unoconv
Unoconv is responsible for converting eligible documents to PDF format so they can be previewed properly and nicely.
- Document processing status
This displays the overall status of the document processing.
Indexer Progress
The Indexer Progress will display the general status of the Indexer.

It displays the following statistics:
- Progress
Percentage of collection index progress.
- Collection
Name of the collection that is currently being indexed.
- Time passed
Time passed since starting indexation on this collection.
- Time remaining
Estimate on the time needed to fully index the current collection.
- Total number
Number of items in this collection that need to be indexed.
- Items processed
Number of items in this collection that have been indexed.
Spider Status
Shows the current status of the spider.

Modules
Modules show what modules are enabled for your appliance. This is dependent on the license key you received during activation.
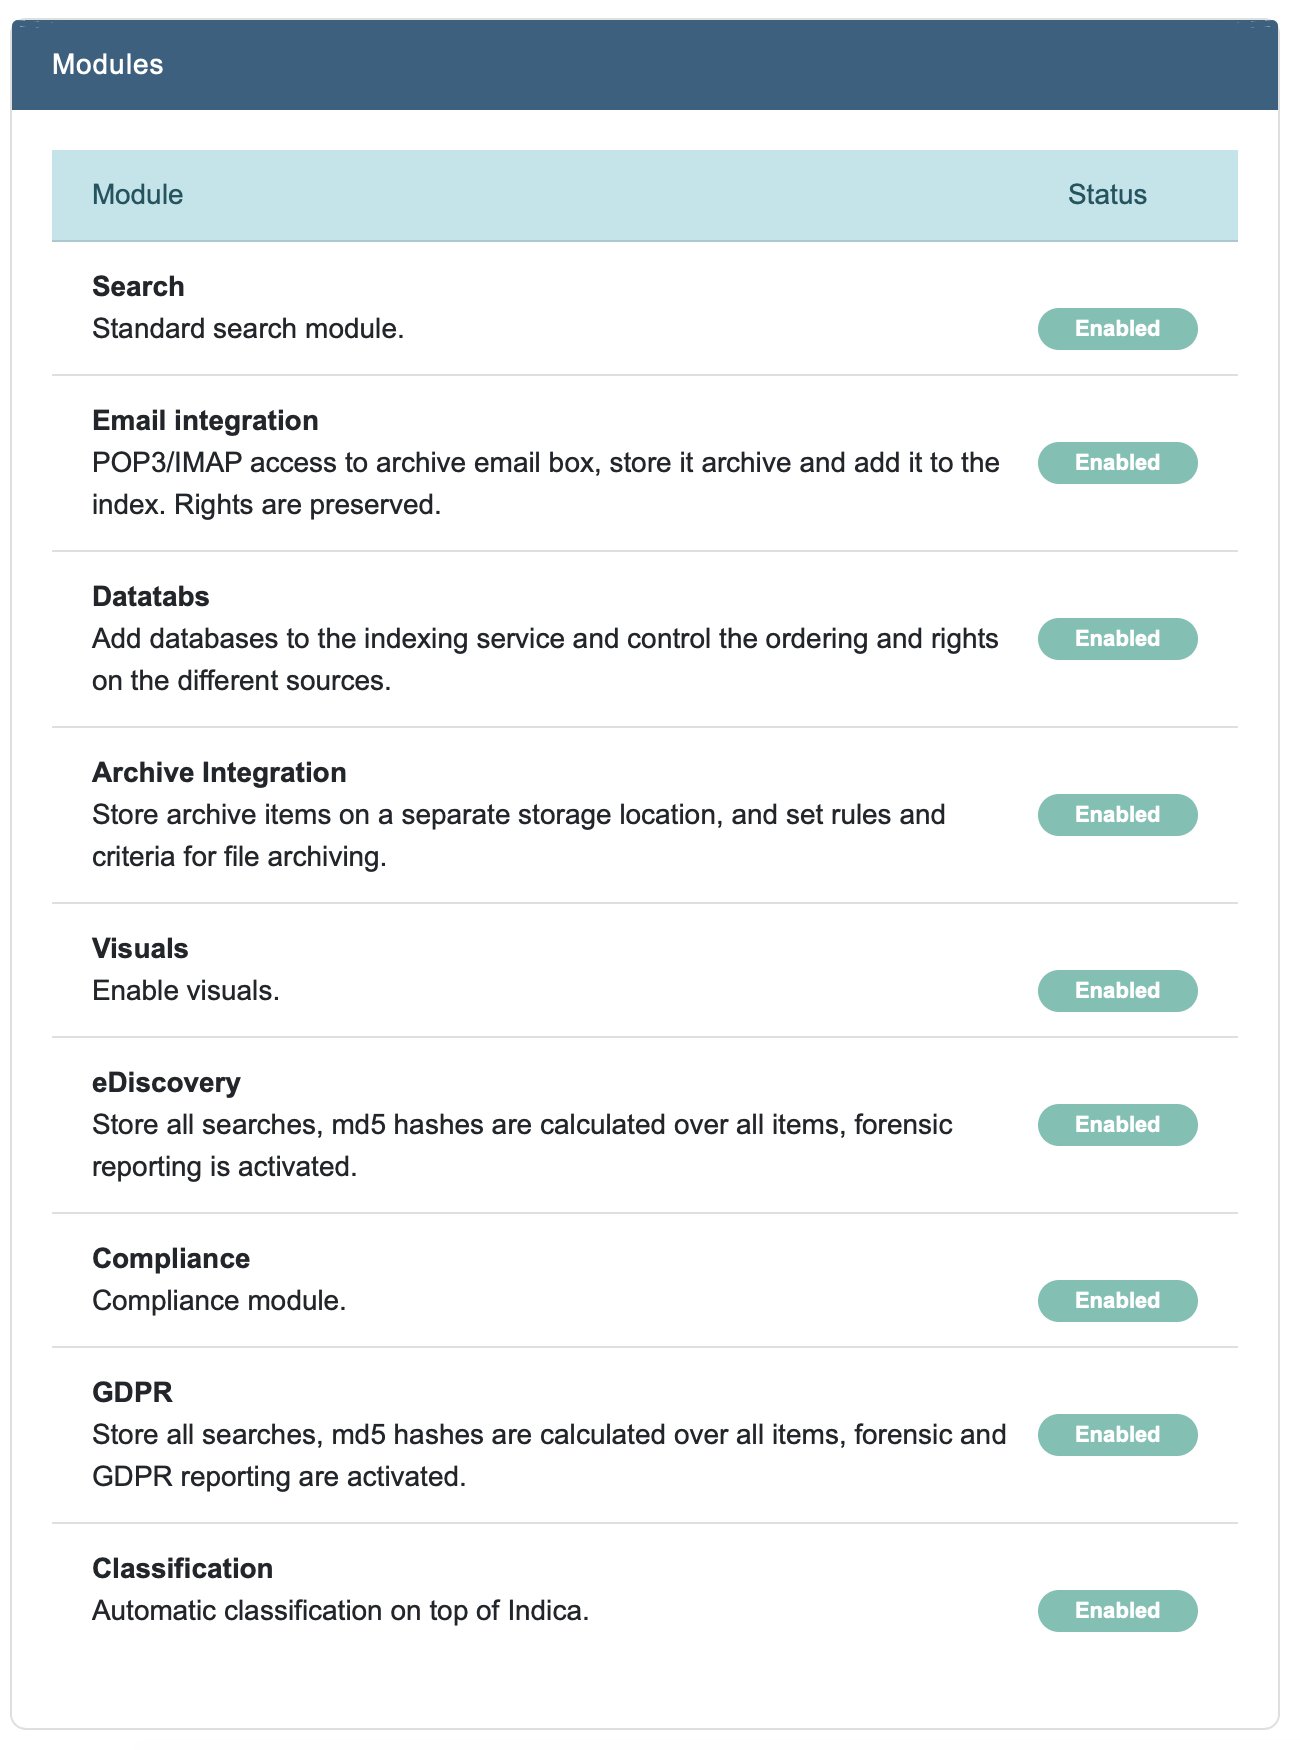
The following modules are availabe:
- Search
Standard search module.
- Email integration
POP3/IMAP access to archive email box, store it archive and add it to the index. Rights are preserved.
- Datatabs
Add databases to the indexing service and control the ordering and rights on the different sources.
- Archive Integration
Enabled Store archive items on a separate storage location, and set rules and criteria for file archiving.
- Visuals
Enable visuals.
- eDiscovery
Store all searches, md5 hashes are calculated over all items, forensic reporting is activated.
- Compliance
Compliance module.
- GDPR
Store all searches, md5 hashes are calculated over all items, forensic and GDPR reporting are activated.
- Classification
Automatic classification on top of Indica.
System Status
System status displays some basic system statistics and the appliances current workload.
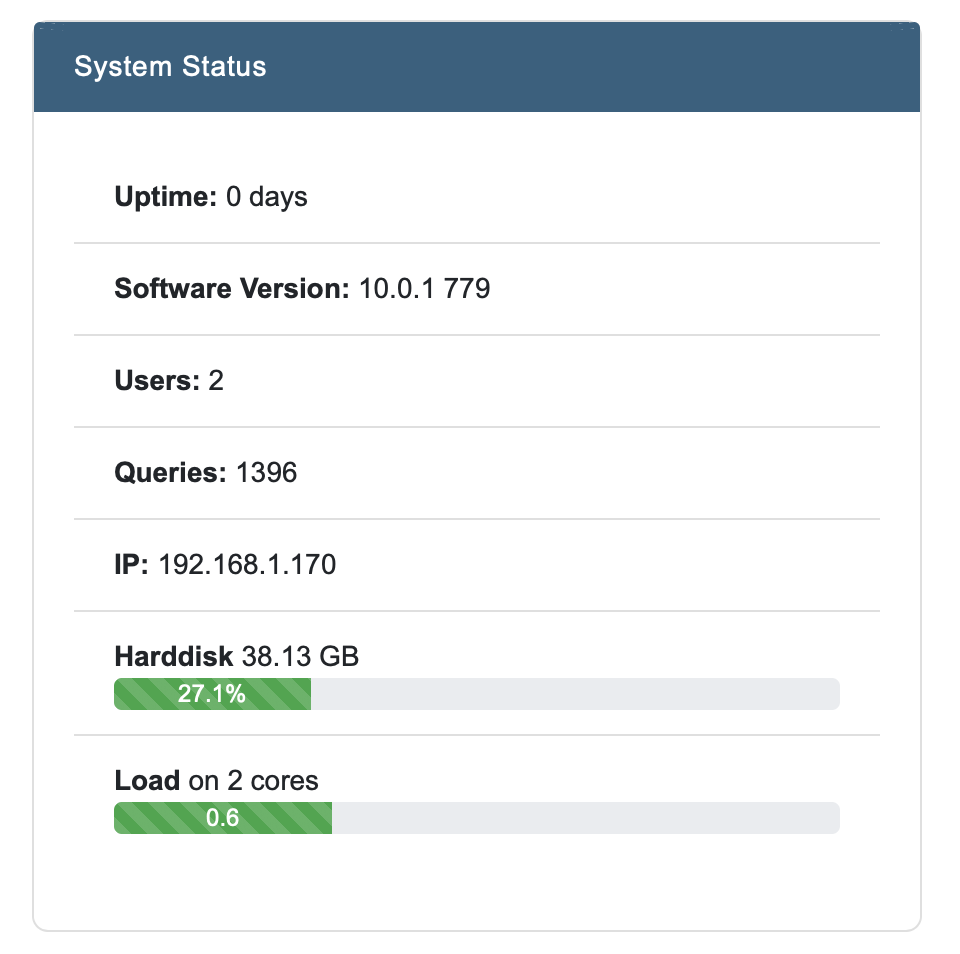
It displays the following statistics:
- Uptime
Current uptime of the appliance.
- Software Version
Current software version.
- Users
Number of users in the system.
- Queries
Total number of queries ran on the appliance. This includes system queries as well.
- IP
Current IP address of the appliance.
- Harddisk
Current disk usage of the appliance.
Note
External mounts are not taken into account.
- Load
Current workload on the appliance.